jal
| ← Importing | Contents | Next: Tax reports → |
10. Reports
Everything JAL knows can be looked at from the Reports menu. Each report opens as a tab, and each has a Save… button that writes what you are looking at to an Excel file.
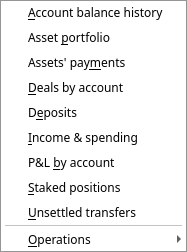
Most reports share the same two controls:
- a period — a preset (Quarter to date, Year to date, This year, Previous year) plus From and To dates you can set yourself;
- a currency — everything is converted into it for the totals.
Income & spending
The one to look at first. What came in and what went out, by category, month by month.
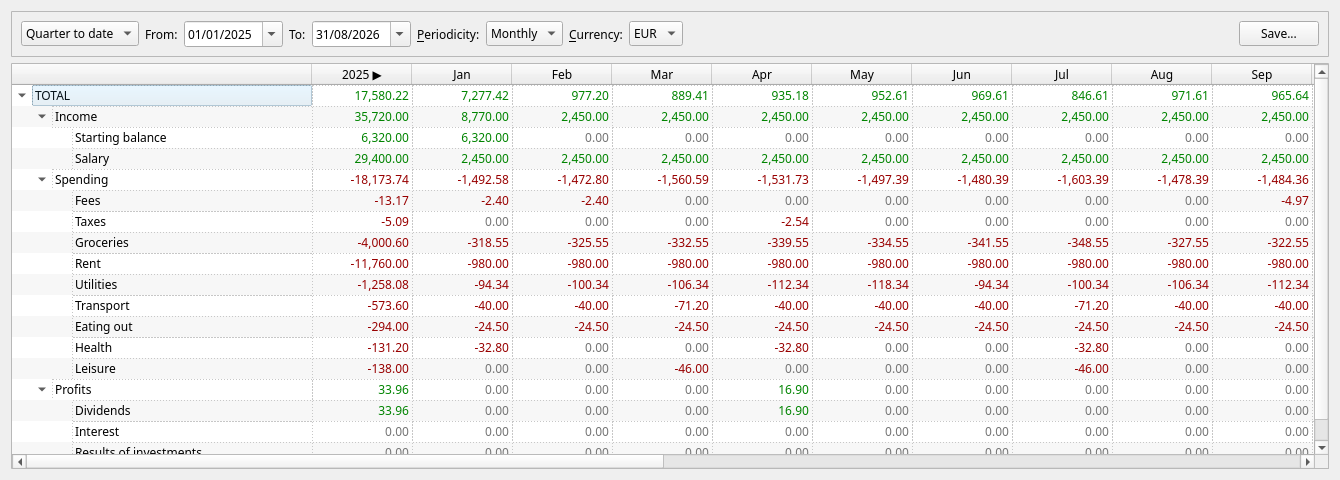
- Rows are your category tree; parents show the sum of everything under them.
- Columns are periods — Periodicity switches between monthly and weekly columns; years are summed into a column of their own.
- The first column is the total for the whole span.
- Green is money in, red is money out.
Right-click any figure and choose Show operations to see the payments behind it.
Account balance history
How much one account held, day by day:
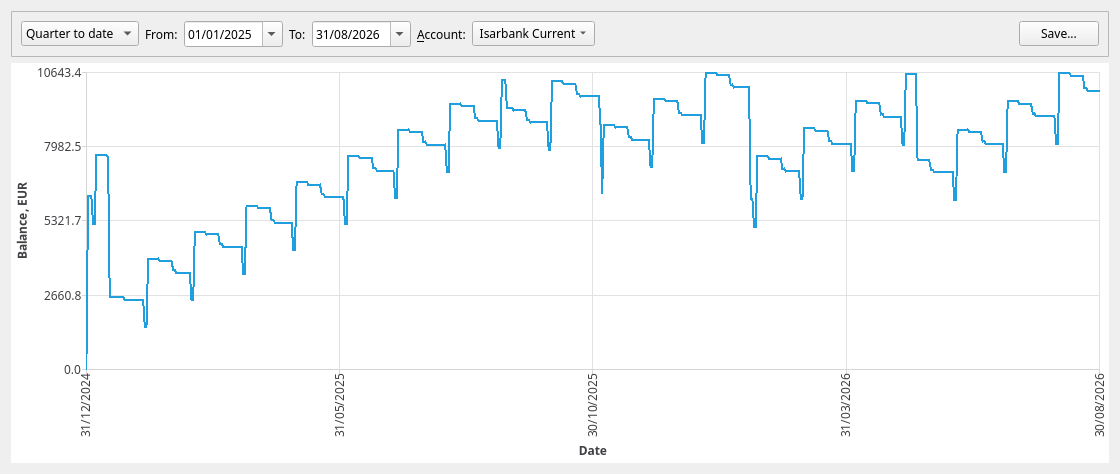
Pick the account and the period. Useful for spotting the month a balance started sliding, and for seeing how regular your income really is.
Asset portfolio
What you own, on a chosen date:
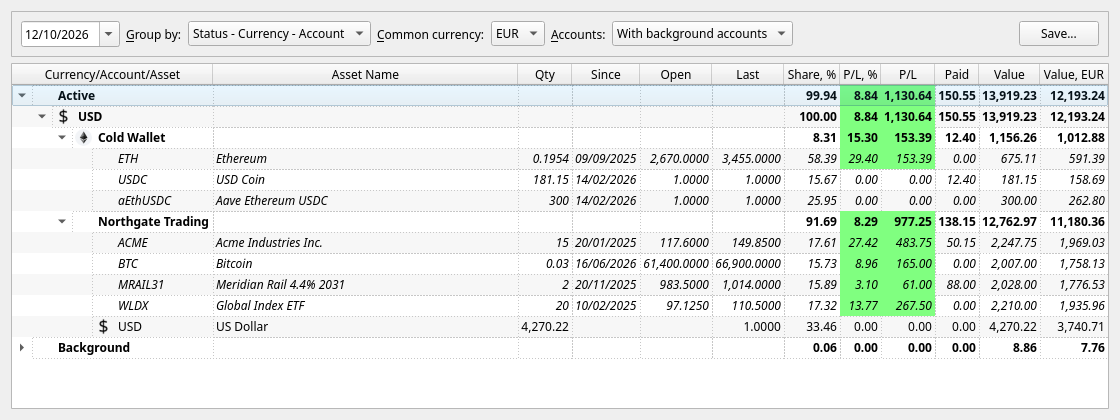
| Column | Meaning |
|---|---|
| Qty | How many units you hold |
| Since | When the oldest lot you still hold was bought |
| Open | The average price you paid for what you still hold |
| Last | The most recent price JAL has |
| Share, % | The position’s weight in the total |
| P/L, % and P/L | Unrealised profit — what you would gain if you sold at Last |
| Paid | What the position has already paid you: dividends, coupons, rewards |
| Value | Quantity × Last, in the account’s currency |
| Value, … | The same, converted into the common currency |
Group by rearranges everything — by currency and account, by asset, by country, by the tag on the asset, by the tag on the account it is held in, or by the status of that account. Accounts says how deep the report reaches: Active accounts only, With background accounts (the default) or With closed accounts. Grouped by status, the background positions come as one folded group with its own total — open it to see what is inside.
Right-click a position for its price chart, a tax estimate, or to give the asset a tag or a country. The same menu folds the groups: Expand all, Collapse all, and — when the report is grouped by more than one thing — Expand to level N, which opens the groups down to that level.
A position with no recent price is valued at the last price JAL has, however old. If a figure looks stale, download quotes (chapter 9).
Deals by account
Every position you have closed, with the profit it produced:
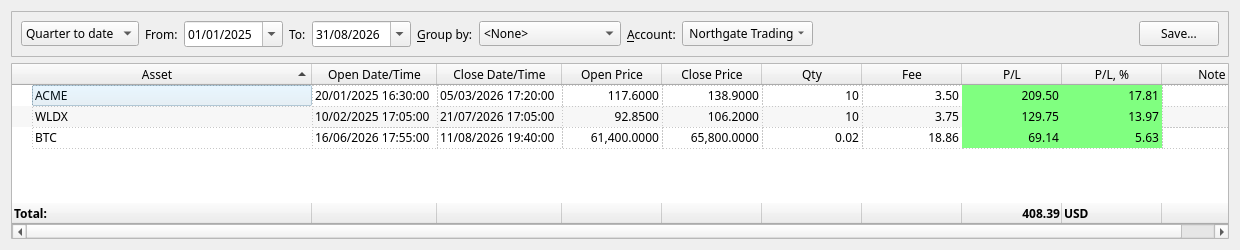
One line per closed deal: when it was opened and closed, at what prices, the quantity, the fees, and the profit in money and per cent. Group by can group them by asset, by the date they were opened or closed, or by combinations of those. The Total at the bottom is the realised profit for the period — the figure most tax authorities are interested in.
P&L by account
What one investment account did, month by month:
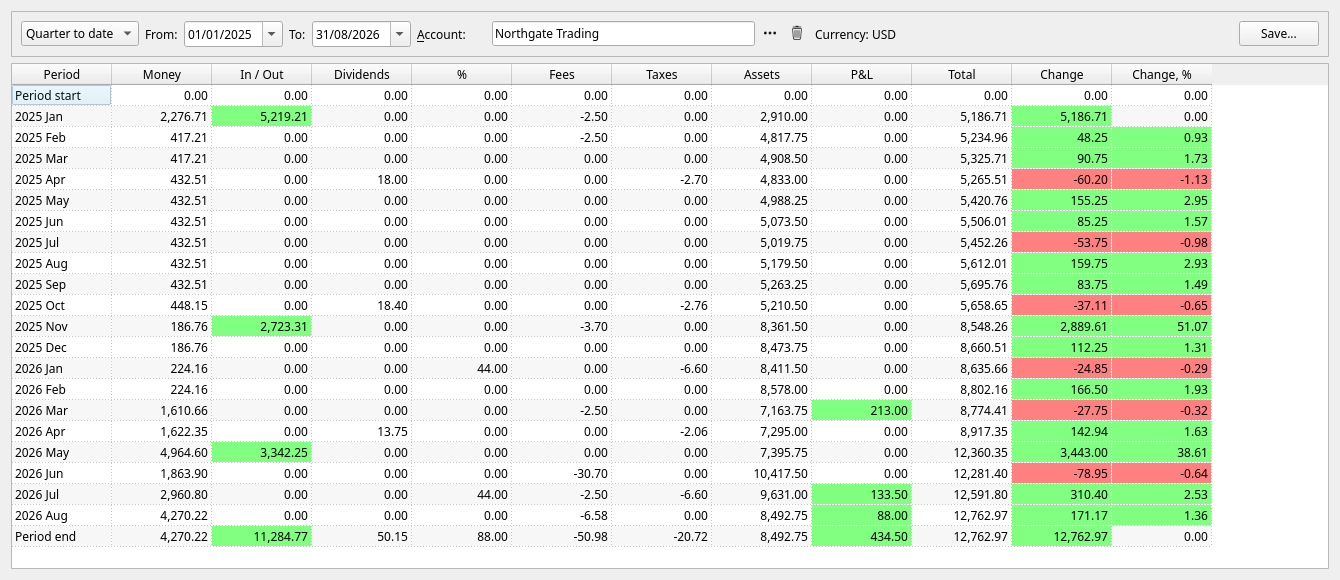
| Column | Meaning |
|---|---|
| Money | Cash on the account at the end of the month |
| In / Out | Money you paid in or took out |
| Dividends, % | Dividends and interest received |
| Fees, Taxes | What was charged |
| Assets | Value of the holdings at the end of the month |
| P&L | Profit realised by deals closed that month |
| Total | Money + assets — what the account is worth |
| Change, Change, % | How the total moved, and how much of that you did not deposit |
The last two columns are the honest answer to “is this account making money?” — money you paid in is not growth, and this report separates the two.
Assets’ payments
Every dividend, coupon and reward an account has received:
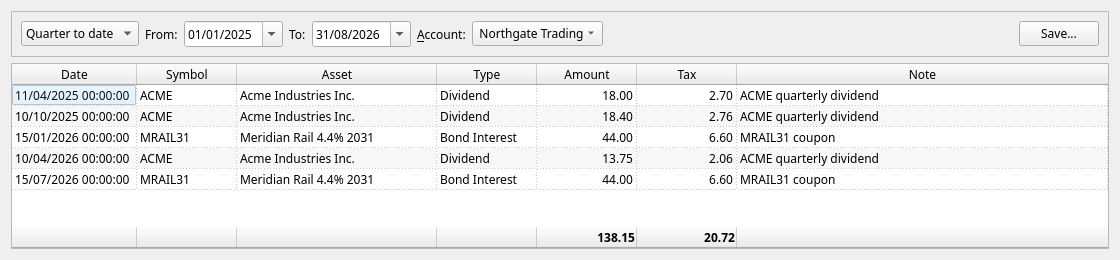
Date, asset, kind of payment, amount, tax withheld and the note. The totals at the bottom are what the account earned in payments over the period, and what was withheld from it.
Deposits
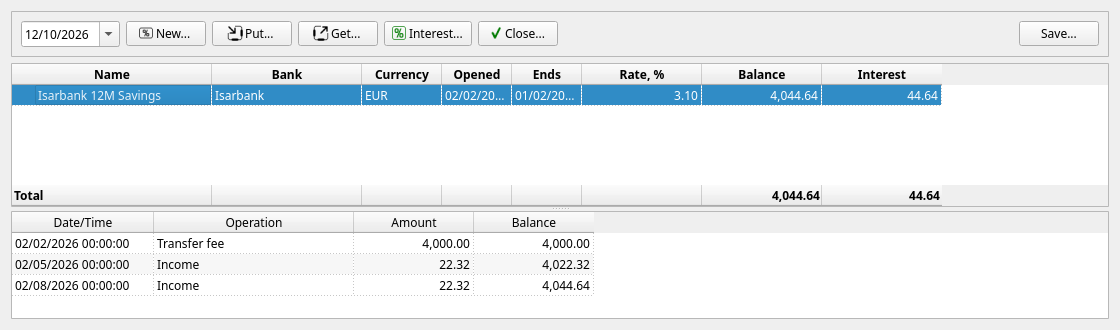
Term deposits — described in full in chapter 7. Right-click a deposit to rename it or to give it a picture.
Staked positions
What you have staked, where, what it is worth, and what it has accrued but not yet paid out — including the rewards that wait at a distributor until you claim them, and the receipt tokens you hold in a wallet (their Accrued is filled only for a rebasing token).
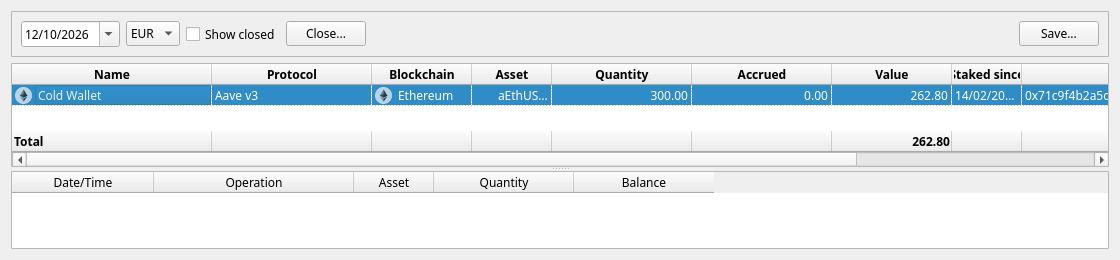 Right-click a position to rename it or to chart what it has accrued. See
chapter 8.
Right-click a position to rename it or to chart what it has accrued. See
chapter 8.
Unsettled transfers
Movements that know only one of their ends — mostly from blockchain fetches and statement imports:

Each row is money or an asset “in transit”. The buttons and the right-click menu let you say what it really was: an account of yours, a staked position, the other leg of a movement already recorded, a swap, a bridge, or dust to be written off. See chapter 8.
Money sent to or received from a person never finds a second account. Payment… (or Record as a spending or an income… in the menu) asks for a peer and a category and replaces the leg by a spending when the money left and by an income when it arrived, a fee of the transfer becoming a Fees line of the same operation.
Keeping this list empty is what keeps your balances honest.
Operations by category, peer or tag
Under Reports → Operations there are three reports with the same shape: pick a category, a peer or a tag, and see every operation that carries it.
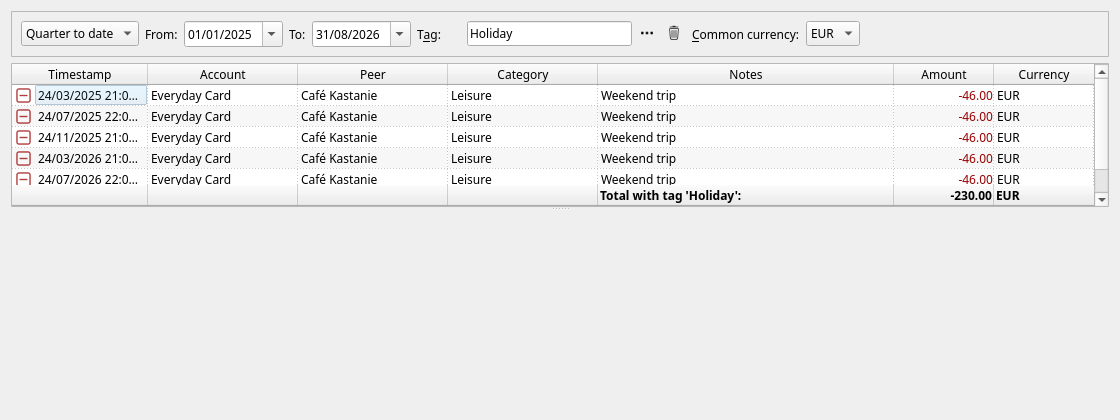
The example above answers “what did that holiday cost me?” — five operations under different categories, brought together by their tag, totalled in one currency.
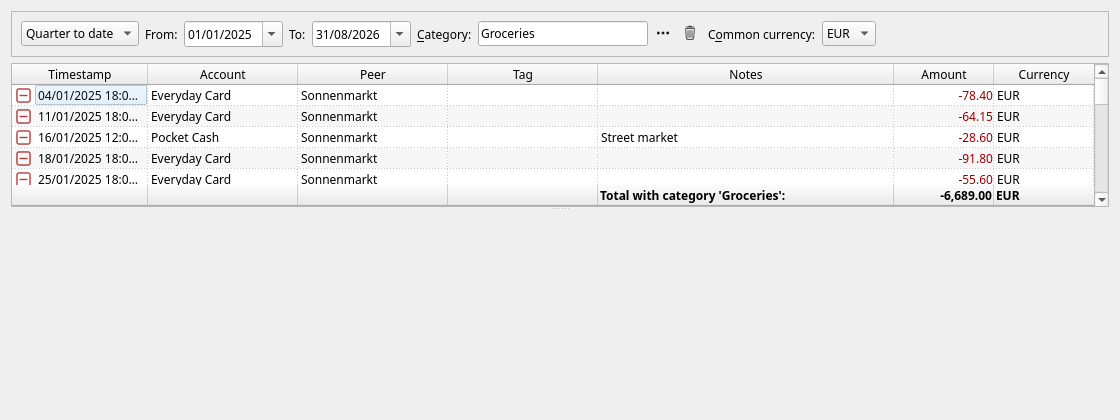
The by category one is also what opens when you right-click a figure in the Income & spending report and choose Show operations — that is how you get from a total to the payments that made it.
Saving a report
Save… writes the report to an .xlsx spreadsheet, exactly as it is shown — same rows, same
columns, same grouping. A report that is a chart is saved as a .png picture instead.
| ← Importing | Contents | Next: Tax reports → |